
Cubes
The user interface provides business intelligence features, called cubes, which allow you to do online and interactive analyses. These can be presented both numerically (using a pivot table) and chartically (using a chart).
Creating a Cube
Creating a cube is done with the Create cube task. This task automatically adds values and dimensions, and the screen type is changed to cube.
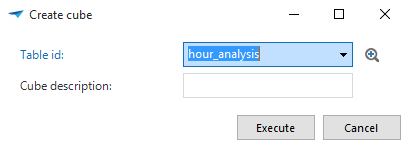 Task to create a cube
If the data source is an OLAP cube, the OLAP connection checkmark must be checked on the form after creating the cube. Three new fields will appear: OLAP server name, OLAP database name and OLAP cube name. The first field refers to the SQL Server instance on which Analysis Services runs. The OLAP database name should be entered in the second field. The third field is the name of the OLAP cube.
For more information on OLAP cubes, see OLAP.
Cube Fields
A cube is made up of cube fields that can be applied by the user. There are two types of fields:
Values - fields for which the value is determined by an aggregation (sum, average, maximum, minimum)
Dimension - fields for which the values can be plotted on the axes and on which can be filtered.
The task with which a cube can be created makes the best possible proposal, but the field definitions will still need to be verified. In any case, all ID columns that have no semantic value for the user must be removed from the cube. They then just provide the connection to the other subjects.
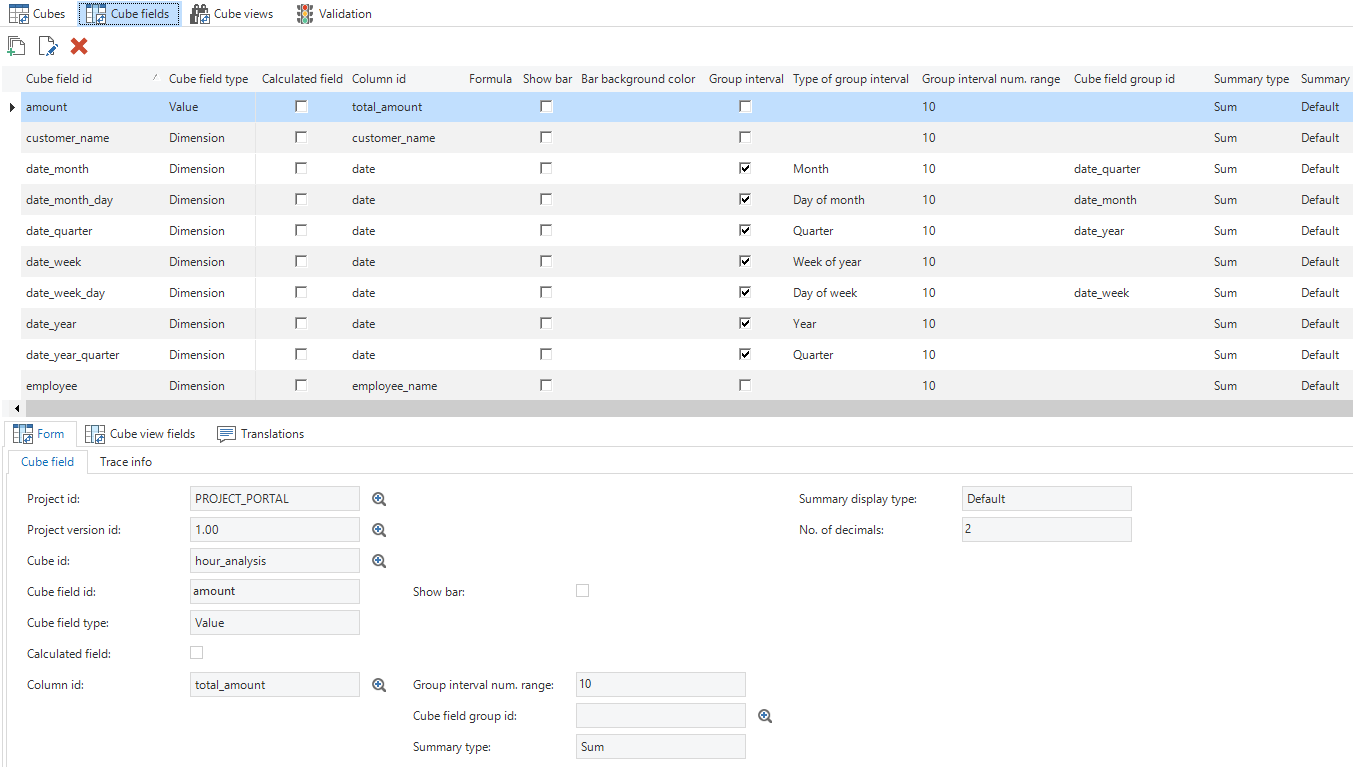 Adding Cube Fields to the 'Cube Fields' tab
It is also important that the measured value(s) that are used in the cube are derived from the Fact Table. This is the data that provides the most detail.
Cube field grouping
It is possible to group cube fields. A group can be collapsed and expanded.
A cube field can be directly linked to another cube field, for example, project activity to project. A project activity will then be shown as a dimension under the project. The project activity is then no longer available as an independent dimension.
In addition, it is possible to create a group interval. For example, a cube field of the dimension type for names in an alphabetical interval. In this way, all names starting with an A are shown in one group.
The possible group interval types are:
Alphabetical - grouping by initial letter
Numeric - interval for a numerical range (for example, per 100 or per 1000)
Date - the date of a date or timestamp
Year - the year of a date or timestamp
Quarter - the quarter of a date or timestamp
Month - the month of a date or timestamp
Week no. of the year - week no. of the year for a date or timestamp
Week of the month - the week of the month for a date or timestamp
Day of the year - the day of the year for a date or timestamp
Day of the month - the day of the month for a date or timestamp
Year age - age in years based on the current date. For this purpose the numerical range can be used, for instance an age group per year or per 10 years (0-9, 10-19 etc.).
Month age - see year age, but then for the age in months.
Week age - see year age, but then for the age in weeks.
Day age - see year age, but then for the age in days.
Cube views
Apart from defining cubes, which the user can work with, the cube views can also be specified in the Software Factory. These can be accessed by the user through the context menu, the ribbon or the cube view bar. A cube view is essentially a predefined format which the user can adapt to their own wishes for personal use.
A cube view consists of a number of mandatory and optional components.
Cube view
Cube view fields
Constant lines (optional)
Filters (optional)
Field totals (optional)
Conditional formatting (optional)
Create a cube view by adding it. Specify a cube view ID and optionally a group. Subsequently, you can specify a number of things that determine the appearance of the view.
Icon
Display totals
Default view
Cube
Chart
Labels
Legend
Fields can then be added to the cube view. It can be specified for each field in which area in the cube it should appear.
Values
Row
Column
Filter
Menu
The last settings that can be added relate to:
Sort sequence
Display top X
Totals
Expand
- For example, for dates (year/month/day)
Once the cube view has been created and the fields have been added, they are available in the cube of the final product. After this, the cube can be further embellished with constant lines, filters, totals, and conditional formatting.
Using the cube view toolbar, the available cube views can be displayed in a bar on the screen, in the same way as prefilters, tasks and reports. In combination with the new cube components, screens can be developed, for example, with only charts and a toolbar to select the view.
Charts
Each overview can be displayed chartically in a two or three-dimensional chart. Dimensions can also be linked to each other so that a hierarchy is created.
Customer - Project
Year - Month - Day
The last example requires three dimensions that are linked via the same date field. Such a field is defined as a group interval with the respective type. This is done automatically for dates.
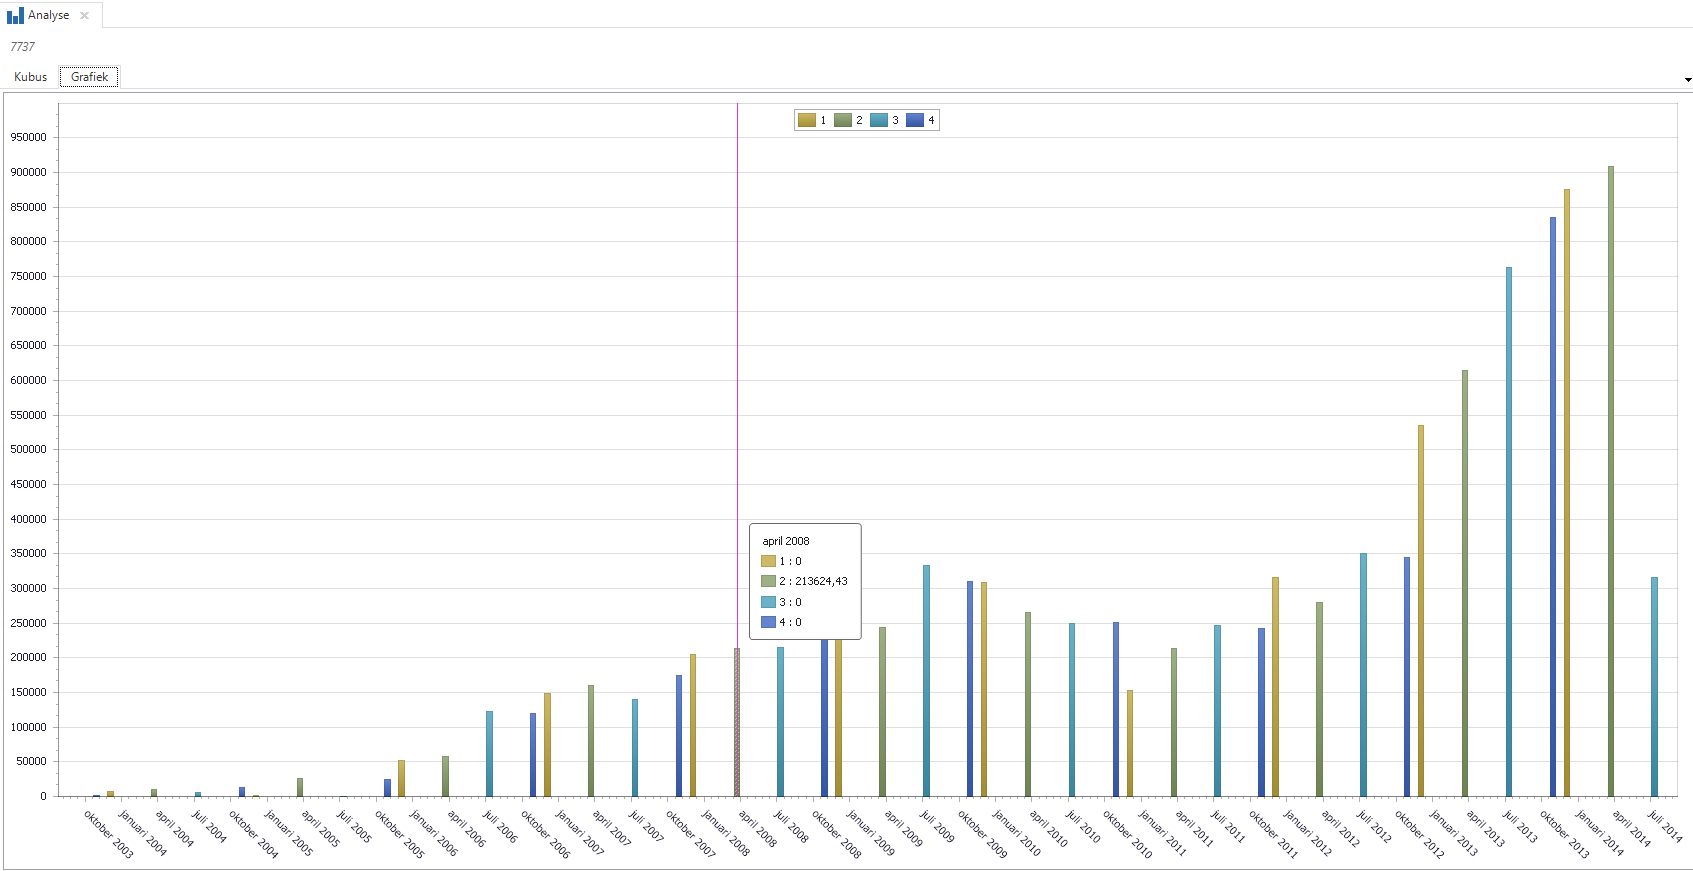 Example of a chart
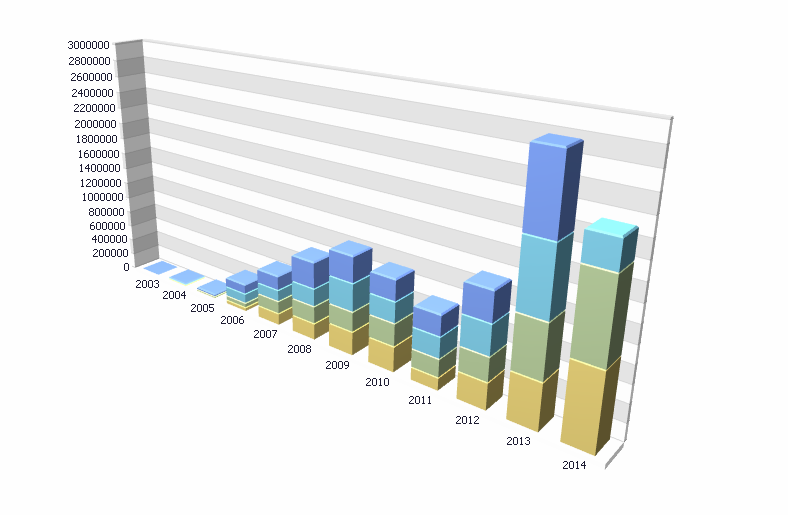 Example of a 3D chart display
Chart type per measured value
In order to combine different types of charts in a chart, measured value can be linked to a particular type of chart. This is done by including the name of the type of chart in the name of the measured value, separated by an underscore, for instance: number_of_hours_spline3d.
Available chart types are:
| List of chart types | ||
|---|---|---|
| Area2D | CandleStick2D | RangeArea2D |
| Area3D | Doughnut2D | RangeArea3D |
| AreaFullStacked2D | Doughnut3D | RangeBar2D |
| AreaFullStacked3D | FullStackedLine2D | RangeSideBySideBar2D |
| AreaStacked2D | FullStackedLine3D | ScatterLine2D |
| AreaStacked3D | FullStackedSplineArea2D | Spline2D |
| Bar3D | FullStackedSplineArea3D | Spline3D |
| BarFullStacked2D | Funnel2D | SplineArea2D |
| BarFullStacked3D | Funnel3D | SplineArea3D |
| BarGrouped3D | Gantt2D | StackedLine2D |
| BarSideBySide2D | GanttSideBySide2D | StackedLine3D |
| BarSideBySideFullStacked2D | Line2D | StackedSplineArea2D |
| BarSideBySideFullStacked3D | Line3D | StackedSplineArea3D |
| BarSideBySideStacked2D | Pie2D | StepArea2D |
| BarSideBySideStacked3D | Point2D | StepArea3D |
| BarStacked2D | RadarArea2D | StepLine |
| BarStacked3D | RadarLine2D | StepLine3D |
| Bubble2D | RadarPoint2D | Stock2D |
| SwiftPlot2D |
Areas in charts
To model an area in a chart, you can use a constant line, the name of which starts with area_. The minimum value can be specified with the Value field and the height or width of the area with Thickness.
Executing tasks
It is also possible to link tasks to a cube table. In that case, it is important that the PK of the table is unique since the GUI uses this to identify the rows in the pivot table. Even if a view is being used, the PK should be set as a unique key.